Description
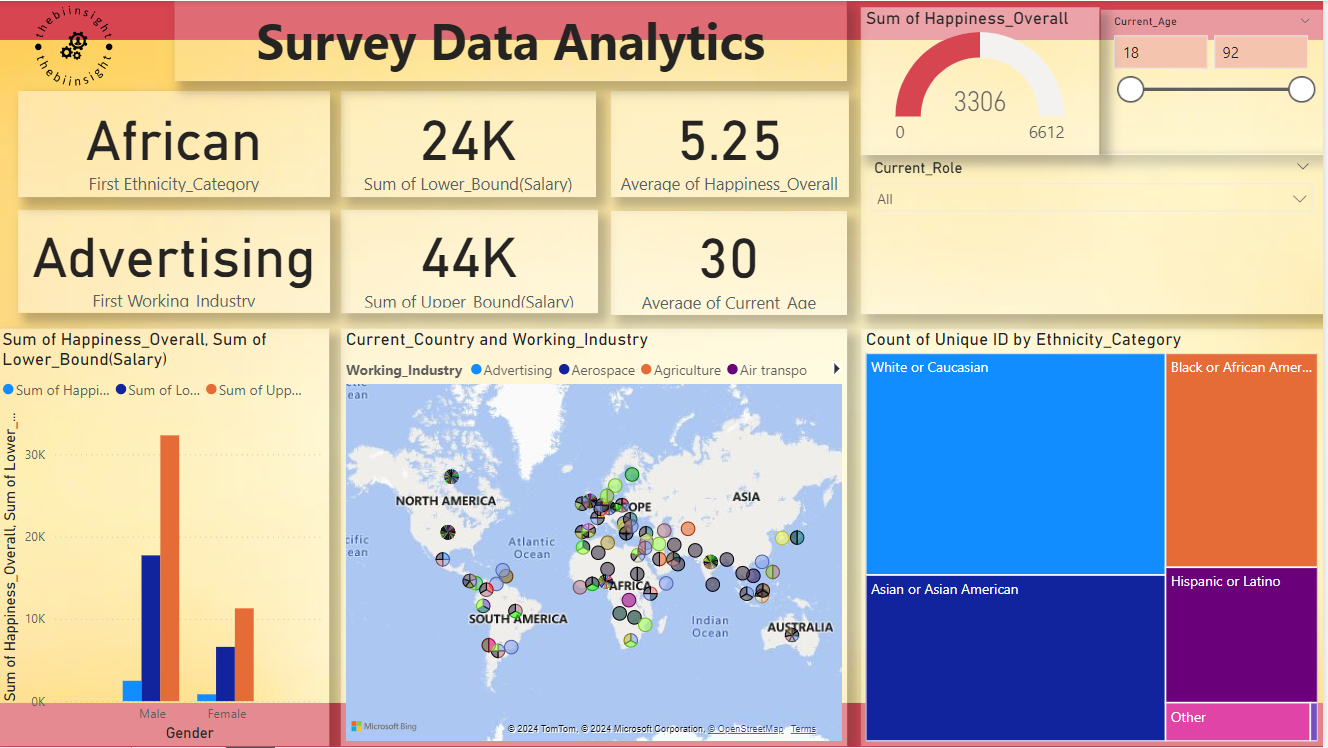
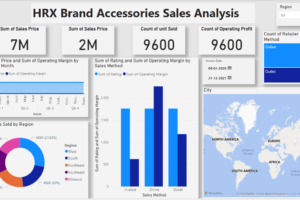
Key features include visual representations of response distributions, trend analysis over time, and sentiment analysis. You can filter data by demographics, survey dates, and specific questions to drill down into the details that matter most. This dashboard helps you identify key areas for improvement, understand the sentiments of your respondents, and make data-driven decisions to enhance your strategies. With interactive charts and graphs, you can easily visualize complex data sets and present your findings in a compelling manner. The Survey Data Only dashboard is ideal for businesses, researchers, and organizations looking to harness the power of survey data to drive positive change.



Reviews
There are no reviews yet.