Description
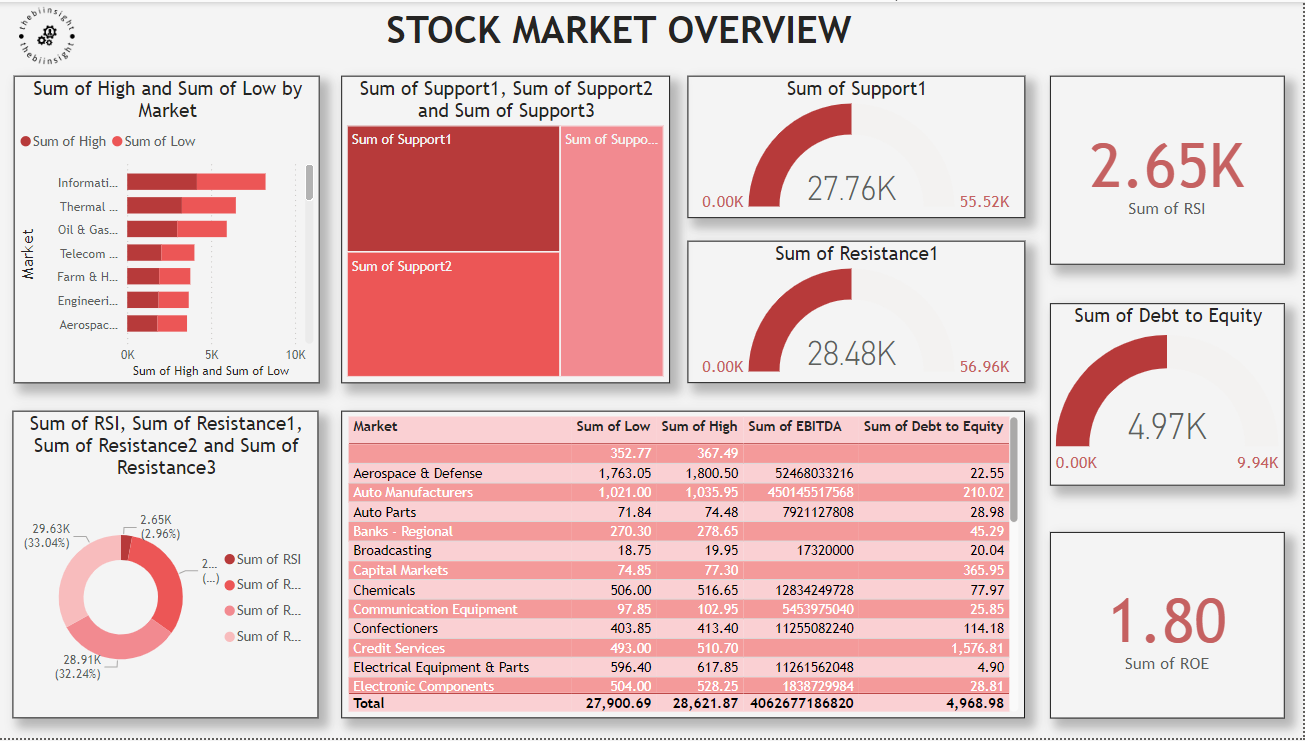
Stock Performance Tracking:- Monitor the performance of individual stocks with metrics such as daily price changes, trading volume, and historical price trends. Use interactive charts to compare stocks over different time periods and identify patterns.
Sector Analysis:- Analyze the performance of various market sectors, such as technology, healthcare, finance, and consumer goods. Understand which sectors are driving market growth and which are underperforming.
Market Indices:- Track major market indices like the S&P 500, NASDAQ, and Dow Jones Industrial Average. Compare index performance and understand how they influence individual stocks and sectors.
Technical Indicators:- Utilize technical analysis tools such as moving averages, relative strength index (RSI), and Bollinger Bands to identify potential trading opportunities and market trends.
News and Sentiment Analysis:- Stay informed with the latest market news and sentiment analysis. The dashboard aggregates news articles and social media sentiment to provide insights into how external factors are impacting the market.
Historical Data:- Access historical market data to perform trend analysis and backtesting of investment strategies. Understand long-term market movements and their implications.
Portfolio Management:- Track your investment portfolio’s performance with metrics like total return, annualized return, and risk-adjusted return. Analyze portfolio allocation and diversification to optimize your investment strategy.
Risk Analysis:- Assess the risk associated with your investments using metrics such as beta, volatility, and Value at Risk (VaR). Understand the potential downside and make informed decisions to manage risk.
Customizable Alerts:- Set up customizable alerts for stock price movements, volume changes, and news events. Stay informed about significant market changes in real-time.
Interactive Visualizations:- Use interactive dashboards with dynamic charts and graphs to visualize complex market data. Customize views to focus on specific stocks, sectors, or indices.
The Stock Market Analysis dashboard is designed to provide you with a comprehensive view of the stock market, enabling you to make informed investment decisions and stay ahead of market trends. Whether you are a seasoned trader or a novice investor, this dashboard offers the tools and insights needed to succeed in the dynamic world of stock trading.



Benjamin Fuchs –
The dashboards are beautifully designed and highly functional. A must-have for transforming data into visually compelling insights.